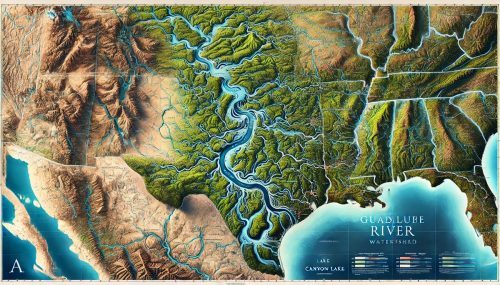
Guadalupe River Watershed Map
Guadalupe River Watershed Map
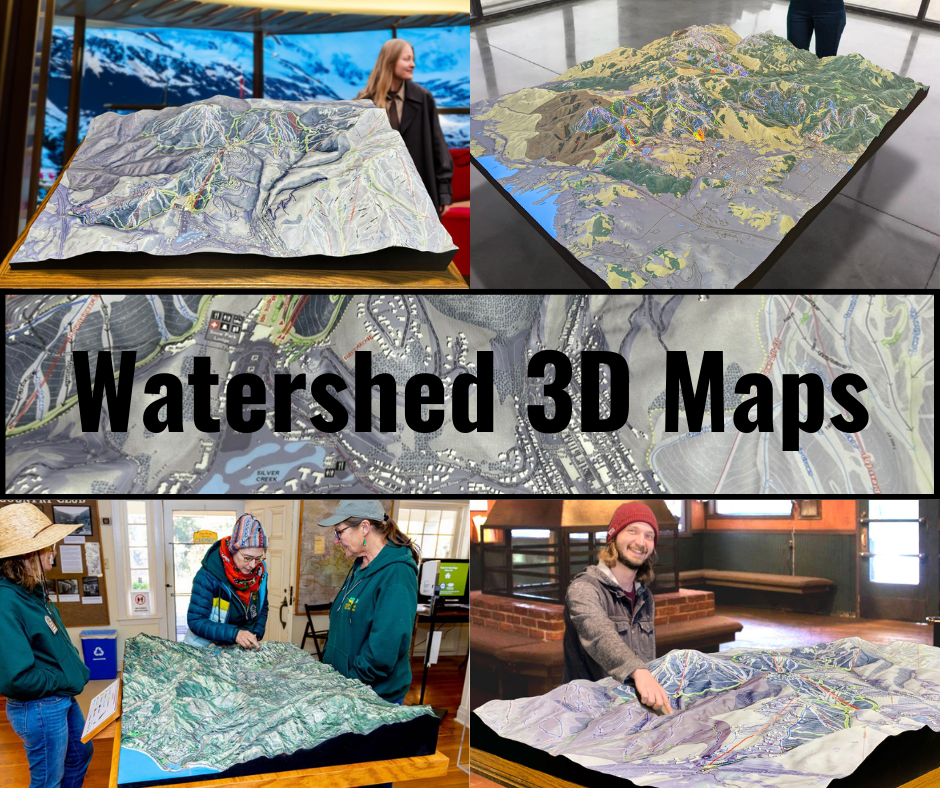
We Build Custom 3D Watershed Maps
The Guadalupe River Watershed Map: Exploring the Vital Lifeline of Central Texas
The Guadalupe River Watershed is a critical hydrological system in Central Texas, spanning approximately 6,616 square miles across a diverse landscape of forests, plains, and urban areas. This watershed, anchored by the Guadalupe River, plays an essential role in supporting agriculture, biodiversity, recreation, and community water needs. The Guadalupe River Watershed Map offers a comprehensive view of this intricate system, illuminating the connections between its rivers, tributaries, wetlands, and reservoirs.
The Guadalupe River Watershed Map helps us understand how this vital waterway sustains both natural ecosystems and human communities. From the river’s headwaters in the Texas Hill Country to its mouth at San Antonio Bay on the Gulf of Mexico, the watershed influences life across a broad region. Thanks to innovations like 3D mapping, we can explore the watershed in unprecedented detail, enhancing our ability to manage and protect it for future generations.

Tracing the Guadalupe River’s Journey: Geography and Hydrology of the Watershed
The Guadalupe River originates from springs in Kerr County, Texas, and flows southeast for approximately 230 miles before emptying into San Antonio Bay. Along its journey, the river winds through a variety of landscapes, including the rugged Texas Hill Country, fertile agricultural plains, and coastal estuaries. The Guadalupe River Watershed Map captures this path, showcasing the river’s intricate network of tributaries, wetlands, and reservoirs.
The watershed includes several key tributaries, such as the Comal River, Blanco River, and San Marcos River. Each contributes to the hydrological complexity and ecological richness of the watershed. The map highlights these tributaries and their interplay with the Guadalupe River, emphasizing their importance in maintaining the overall health of the system.
Reservoirs like Canyon Lake are central features of the watershed, providing flood control, water storage, and recreational opportunities. The Guadalupe River Watershed Map integrates these reservoirs into the broader hydrological framework, illustrating their role in regulating water flow and supporting both human and environmental needs.
Ecosystems and Biodiversity in the Guadalupe River Watershed
The Guadalupe River Watershed is home to diverse ecosystems that support an array of plant and animal species. From the upland forests of the Texas Hill Country to the coastal wetlands near San Antonio Bay, these habitats are vital for maintaining ecological balance. The Guadalupe River Watershed Map provides a detailed perspective on these ecosystems, illustrating their distribution and connections.
Riparian zones along the Guadalupe River and its tributaries are critical habitats for wildlife, offering shelter, food, and water for species such as herons, river otters, and Guadalupe bass—the state fish of Texas. These areas also stabilize riverbanks, filter pollutants, and maintain water quality. The map emphasizes these riparian corridors, showcasing their ecological importance and vulnerability to human activities.
Wetlands in the lower reaches of the watershed act as natural buffers, absorbing floodwaters and filtering out nutrients and sediments. These wetlands provide habitat for amphibians, fish, and migratory birds, while also supporting essential ecosystem services like carbon storage. The map highlights these wetlands, helping conservationists prioritize areas for protection and restoration.
The estuaries and coastal habitats near San Antonio Bay are nurseries for a variety of marine life, including shrimp, crabs, and redfish. These ecosystems depend on the river’s flow to maintain the delicate balance of salinity and nutrients that supports biodiversity. The map illustrates the connection between the river’s hydrology and these vital coastal habitats, emphasizing the need to sustain adequate freshwater inflows.
Human Influence and Water Management in the Guadalupe River Watershed
Human activity has significantly shaped the Guadalupe River Watershed, from Indigenous land stewardship to modern agriculture, urban development, and industrial use. These influences have altered the watershed’s natural dynamics, creating both opportunities and challenges. The Guadalupe River Watershed Map provides a comprehensive view of these interactions, helping stakeholders address critical management issues.
Agriculture is a dominant land use in the watershed, with crops such as cotton, corn, and hay grown extensively across the region. Irrigation from the Guadalupe River and its tributaries is essential for sustaining these crops, but it also contributes to challenges such as nutrient runoff, soil erosion, and habitat loss. The map identifies agricultural areas and their proximity to rivers and wetlands, offering insights into how farming practices affect water resources and ecosystem health.
Urban centers like New Braunfels, Seguin, and Victoria add complexity to the watershed. The map highlights these cities and their associated infrastructure, including stormwater systems, wastewater treatment plants, and industrial sites. Understanding the relationship between urban development and the watershed’s hydrology is crucial for reducing pollution and managing water sustainably.
Water allocation within the watershed is a contentious issue, as competing demands from agriculture, municipalities, industries, and environmental groups put pressure on limited resources. The map serves as a visual tool for navigating these complexities, helping stakeholders balance competing needs and develop equitable water management strategies.
Seasonal Dynamics and Climate Change Impacts
The Guadalupe River Watershed experiences distinct seasonal patterns, with higher water levels during spring rains and lower levels in the dry summer months. The Guadalupe River Watershed Map captures these seasonal dynamics, illustrating how water availability changes throughout the year. This understanding is essential for managing water resources and anticipating the impacts of extreme weather events.
Climate change poses significant challenges for the watershed, threatening to disrupt its hydrological balance. Rising temperatures, altered precipitation patterns, and more intense storms are likely to exacerbate issues such as flooding, drought, and water quality degradation. The map provides a framework for modeling these changes and developing adaptive strategies to protect communities and ecosystems.
Fabricating Guadalupe River Watershed 3D Maps: A New Perspective
The creation of 3D watershed maps for the Guadalupe River Watershed represents a groundbreaking advancement in how we study and manage complex hydrological systems. These maps provide a detailed, tactile, and immersive view of watersheds, combining topographical data with hydrological insights to enhance understanding and decision-making.
The process begins with the collection of high-resolution data using technologies like LiDAR, satellite imagery, and ground surveys. This data is processed into a digital elevation model (DEM), which forms the foundation for the 3D map. Geographic Information Systems (GIS) software is then used to integrate additional layers of information, such as vegetation, infrastructure, and climate data.
Once the digital model is complete, it can be visualized virtually or transformed into a physical representation using 3D printing technology. Physical maps are created layer by layer, using materials like resin or plastic to replicate the terrain with precision. Hand-painted details enhance the visual realism, creating an engaging and informative tool.
3D watershed maps offer numerous benefits. They allow researchers to simulate the impacts of land use changes, assess flood risks, and identify critical habitats. For the Guadalupe River Watershed, such maps could provide valuable insights into the interaction between surface water, groundwater, and wetlands, helping stakeholders make informed decisions about conservation and management.
The Future of the Guadalupe River Watershed and Its Map
The Guadalupe River Watershed faces a future shaped by both challenges and opportunities. As climate change, population growth, and land use pressures continue to evolve, the Guadalupe River Watershed Map will play an increasingly critical role in guiding sustainable management and conservation efforts.
Advances in mapping technology promise to revolutionize how we understand and interact with the watershed. Real-time data integration, artificial intelligence, and augmented reality interfaces could provide even more dynamic and detailed visualizations, enabling stakeholders to anticipate changes and develop adaptive strategies. For example, integrating live hydrological data into the map could improve flood preparedness and drought response.
The Guadalupe River Watershed Map is more than a tool; it’s a confirmation to the interconnectedness of nature, community, and innovation. By embracing the insights it provides and the technologies it inspires, we can ensure the long-term health and vitality of this essential river system for generations to come.
Check out WhiteClouds’ 3D Maps for more information on Guadalupe River watershed maps.
