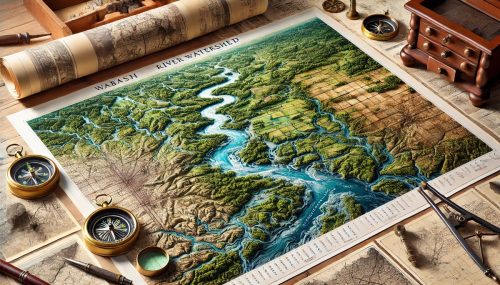
Wabash River Watershed Map
Wabash River Watershed Map
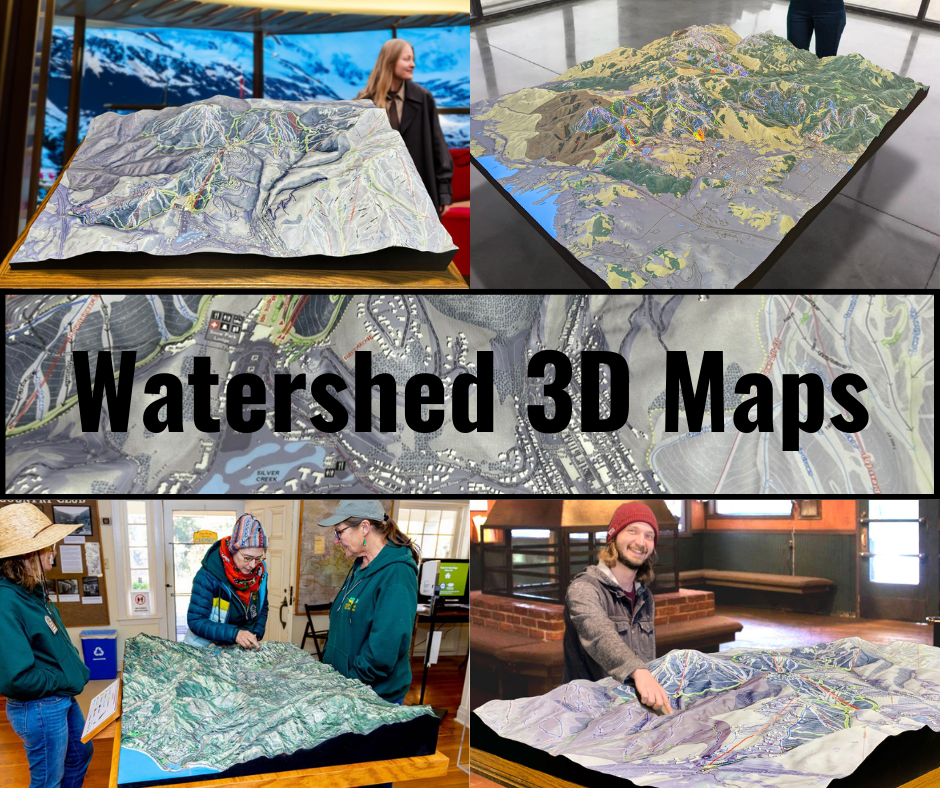
We Build Custom 3D Watershed Maps
The Wabash River Watershed Map: A Gateway to Understanding the Heart of the Midwest
The Wabash River Watershed is more than just a geographical feature; it’s a lifeline, a resource, and an ecological marvel that embodies the intricate balance between nature and human activity. Stretching across vast portions of the Midwest, this watershed encompasses thousands of miles of rivers, tributaries, and streams, all converging to sustain ecosystems, agriculture, and urban areas. The Wabash River Watershed Map is not merely a tool for visualization; it’s a portal into the history, science, and future of one of America’s most significant hydrological systems. By exploring the details of the Wabash River Watershed Map, we gain insights into its complexity and the challenges of maintaining its health. Alongside this, advancements in 3D mapping technologies—such as those used for the Green River Watershed—reveal how cutting-edge tools are reshaping the way we study and interact with these critical systems.

The Scope and Significance of the Wabash River Watershed
The Wabash River originates from the glacial plains of Ohio and Indiana, carving its path over 500 miles to join the Ohio River in southern Illinois. This river, along with its expansive watershed, covers approximately 33,000 square miles across three states: Indiana, Illinois, and Ohio. It sustains countless ecosystems, supports agriculture, and serves as a key water source for millions of people. Beyond its physical reach, the Wabash River Watershed holds cultural and historical significance, with roots in Native American heritage and its role in shaping the Midwest’s economy and settlement patterns.
The watershed map provides a comprehensive view of this expansive system, highlighting how interconnected streams, rivers, and groundwater sources converge to shape the landscape. It offers a glimpse into the diversity of terrain, from the rolling plains of Indiana to the forested regions of southern Illinois, emphasizing the watershed’s role as a dynamic ecological corridor. This map is not just a tool for scientists; it’s an educational resource for communities, policymakers, and conservationists.
Understanding Hydrology Through the Wabash River Watershed Map
The hydrology of the Wabash River Watershed is intricate, defined by a network of tributaries such as the Tippecanoe, White, and Vermilion Rivers. Each tributary contributes to the watershed’s complexity, regulating water flow and sediment transport while supporting local ecosystems. The watershed map captures these features in remarkable detail, showcasing the natural patterns of water movement and areas prone to flooding or erosion.
Watershed maps are essential for understanding how water interacts with the land. In the Wabash River Watershed, precipitation collects in streams and rivers, eventually flowing into the Ohio River. The map highlights critical zones where land use—such as agriculture, urbanization, and deforestation—can impact water quality and availability. It also illustrates how changes in one part of the watershed, such as increased runoff in agricultural areas, can have cascading effects downstream.
Modern mapping technologies have enhanced our ability to visualize and analyze these patterns. Geographic Information Systems (GIS) allow for the integration of topographical, hydrological, and ecological data, enabling researchers to model the watershed’s behavior under various scenarios, such as heavy rainfall or drought conditions. This capability is vital for planning sustainable land use and mitigating environmental impacts.
Mapping Ecosystems and Biodiversity in the Wabash River Watershed
The Wabash River Watershed is home to a diverse array of ecosystems, including wetlands, forests, and grasslands. These habitats support an impressive range of biodiversity, from aquatic species like smallmouth bass and freshwater mussels to terrestrial animals such as deer, foxes, and migratory birds. Watershed maps are invaluable for identifying and protecting these critical habitats.
Wetlands are among the most important ecosystems in the watershed, acting as natural water filters and flood buffers. The map highlights the location and extent of these areas, providing a basis for conservation efforts. By visualizing changes in wetland coverage over time, researchers can assess the impacts of land use and climate change on the watershed’s ecological health.
The watershed is also part of the Mississippi Flyway, a major migratory route for birds. Mapping these migration corridors allows conservationists to identify key stopover sites and prioritize them for protection. By connecting ecological data with geographical features, the Wabash River Watershed Map becomes a tool for promoting biodiversity and ecological resilience.
Watershed Maps for Flood Management and Water Quality Monitoring
Flooding is a natural phenomenon in the Wabash River Watershed, particularly during periods of heavy rainfall or snowmelt. The watershed map is an essential tool for managing flood risks, identifying vulnerable areas, and designing infrastructure such as levees and retention basins. Topographical data on the map reveals floodplains and areas where water naturally collects, helping planners develop strategies to mitigate damage.
Water quality is another critical aspect of watershed management. The map helps track sources of pollution, such as agricultural runoff, industrial discharges, and urban wastewater. By overlaying data on land use and hydrology, the map identifies hotspots for nutrient pollution, which can lead to harmful algal blooms and oxygen-depleted zones in downstream waters.
Fabricating Green River Watershed 3D Maps: The Art and Science
While traditional maps are invaluable, 3D maps offer a revolutionary way to visualize watersheds. The Green River Watershed, a neighboring system, has become a pioneer in 3D mapping technology, demonstrating how these tools can transform our understanding of hydrology and geography.
Creating a 3D map begins with data collection. Technologies like LiDAR (Light Detection and Ranging) and satellite imagery provide high-resolution topographical and hydrological data. This information is then processed using GIS software to create a digital elevation model (DEM), which forms the foundation for the 3D representation.
Next, advanced 3D modeling software translates the DEM into a detailed, interactive map. Designers add layers of information, such as vegetation cover, water flow, and human infrastructure, to enhance the map’s utility. The final step involves either digital visualization or physical fabrication. For physical models, 3D printing technology builds the map layer by layer, using materials like resin or plastic. These tactile maps are not only visually stunning but also educational tools that bring the watershed to life.
3D maps have practical applications in planning, conservation, and education. For example, they allow planners to simulate the effects of land use changes on water flow or visualize potential flood impacts in three dimensions. In classrooms and museums, these maps engage audiences by making complex systems tangible and accessible.
The Future of Watershed Mapping and Conservation
As technology continues to evolve, watershed maps will become even more sophisticated, integrating real-time data and predictive analytics. The Wabash River Watershed Map is already a powerful tool, but future innovations may include augmented reality (AR) interfaces, allowing users to interact with the map in entirely new ways.
Conservation efforts will also benefit from advancements in mapping. By providing a clearer picture of the watershed’s health, these maps enable targeted interventions to restore degraded habitats, protect biodiversity, and ensure sustainable water management. As climate change poses new challenges, the ability to model and visualize its impacts will be essential for adapting to a rapidly changing environment.
The Wabash River Watershed Map represents more than just a snapshot of a region; it’s a testament to the interconnectedness of natural systems and the importance of preserving them. By combining traditional cartography with cutting-edge technologies like 3D mapping, we can deepen our understanding of these vital systems and work toward a future where nature and humanity coexist in harmony.
Check out WhiteClouds’ 3D Maps for more information on Wabash River watershed maps.
