Florida, with its unique blend of lush forests, sunny beaches, and dynamic cities, has been an essential subject for cartographers throughout history. Maps of Florida are more than just tools for navigation—they are windows into the evolution of the state, reflecting the changes in geography, culture, and politics over time. From early explorers sketching the coastline of the New World to modern satellite imagery mapping its sprawling urban centers, Florida’s maps have captured the essence of its transformation. The state’s coastline, with its peninsulas, islands, and intricate network of rivers, has been an especially challenging yet fascinating feature for mapmakers. These maps are not just representations of landmasses—they tell the story of the indigenous peoples who first inhabited Florida, the European settlers who arrived and made their mark, and the diverse cultures that have shaped its cities and communities. Florida’s history is literally mapped out on the paper—each line, curve, and boundary marks the growth of industries, the rise of tourism, and the rapid urbanization of once-wild swamplands. From the rugged Everglades to the majestic Florida Keys, each map offers a unique perspective on the natural beauty and challenges that define the state. Beyond the physical landscape, Florida’s maps hold cultural significance, with every charted road or marked city highlighting the state’s shifting demographics, economy, and even political influence. As Florida continues to grow and evolve, its maps will remain an essential part of its story, capturing the intersection of history, geography, and innovation in the state’s ongoing journey.
Top 10 Florida Maps
Top 10 Florida Maps
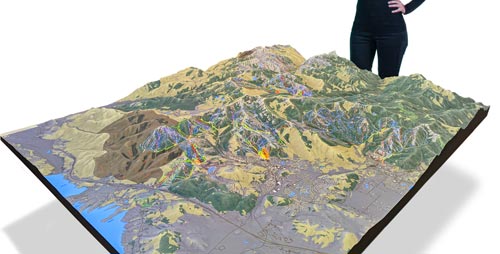
WhiteClouds builds 3D Raised Relief Maps
Florida, with its unique geography and rich history, has been the subject of numerous maps over the centuries, each contributing to our understanding of the state’s development and transformation. From the earliest European explorations to the modern era of digital mapping, Florida’s maps offer insights into its physical, cultural, and historical landscape. These maps reflect the growth of cities, the establishment of boundaries, and the evolution of transportation and infrastructure. Below is a list of the top 10 Florida maps, ranked by size, with a look into their historical context, geographical features, and significance.
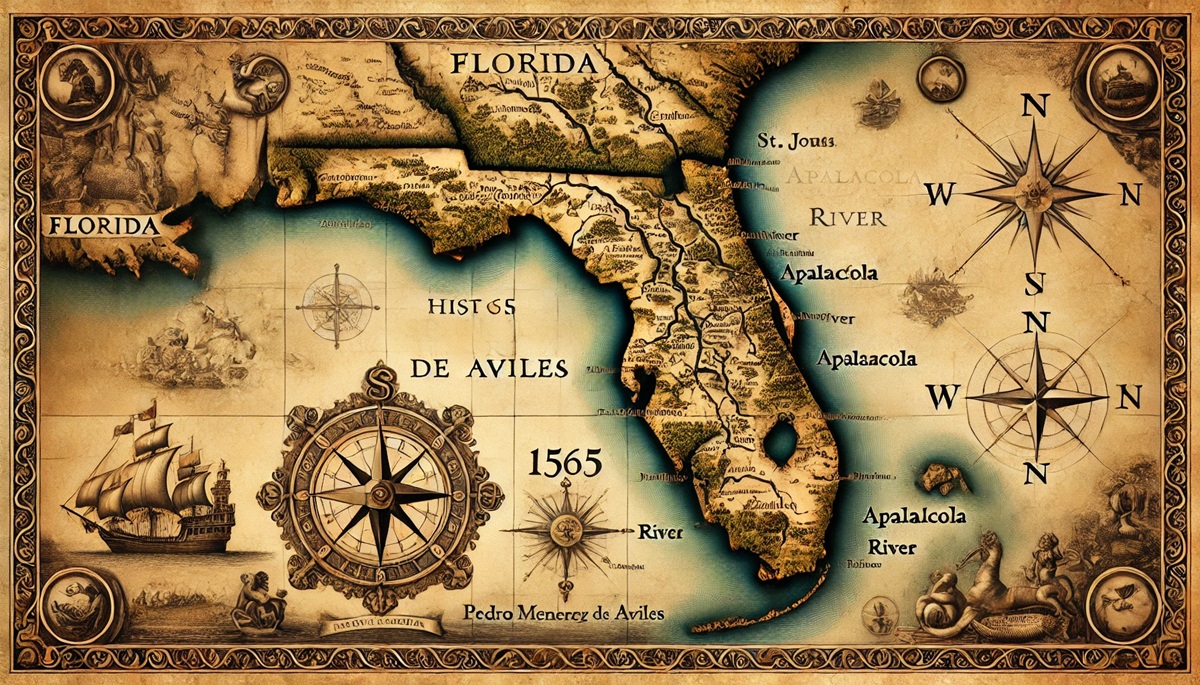
#1: The 1565 Map of Florida by Pedro Menéndez de Avilés, 150,000 Square Miles
The 1565 map of Florida by Pedro Menéndez de Avilés is one of the earliest European depictions of Florida, drawn during the time of Spanish colonization. Measuring approximately 150,000 square miles, this map is considered one of the first to show the coastline of Florida in detail. Menéndez de Avilés, the Spanish explorer and admiral, was tasked with establishing a permanent Spanish presence in Florida, and this map was a crucial tool in that effort. It outlines the regions Menéndez encountered, including the St. Johns River, the Apalachicola River, and the region around present-day St. Augustine, the oldest continuously inhabited European-established settlement in the continental U.S. The map also includes early depictions of Native American territories, providing a glimpse into the cultural landscape of the area before European settlement. The most interesting aspect of this map is that it reflects the first successful European settlement in Florida, marking a pivotal moment in the state’s history. Anecdotal stories from historians often highlight how this map provided essential navigational information for future Spanish expeditions.
#2: The 1715 Spanish Shipwreck Map of Florida, 120,000 Square Miles
The 1715 Spanish Shipwreck Map of Florida is a rare and significant map that showcases the coastline and shipping routes around Florida during the early 18th century. Measuring around 120,000 square miles, this map marks the location of the infamous Spanish treasure fleet’s shipwrecks off the coast of Florida, particularly along the central and southeastern regions. The fleet, carrying vast amounts of treasure from the Americas to Spain, was struck by a hurricane, resulting in the loss of several ships and a wealth of gold and silver. The map highlights the sites of these shipwrecks and provides details of the ocean currents, making it a valuable resource for maritime historians. An interesting fact about this map is that it became a guide for treasure hunters and archaeologists who continue to search for remnants of the sunken fleet. The map also offers insight into the challenges of navigating the treacherous waters off Florida’s coast, where powerful storms and shifting sandbars claimed many ships during the colonial era.
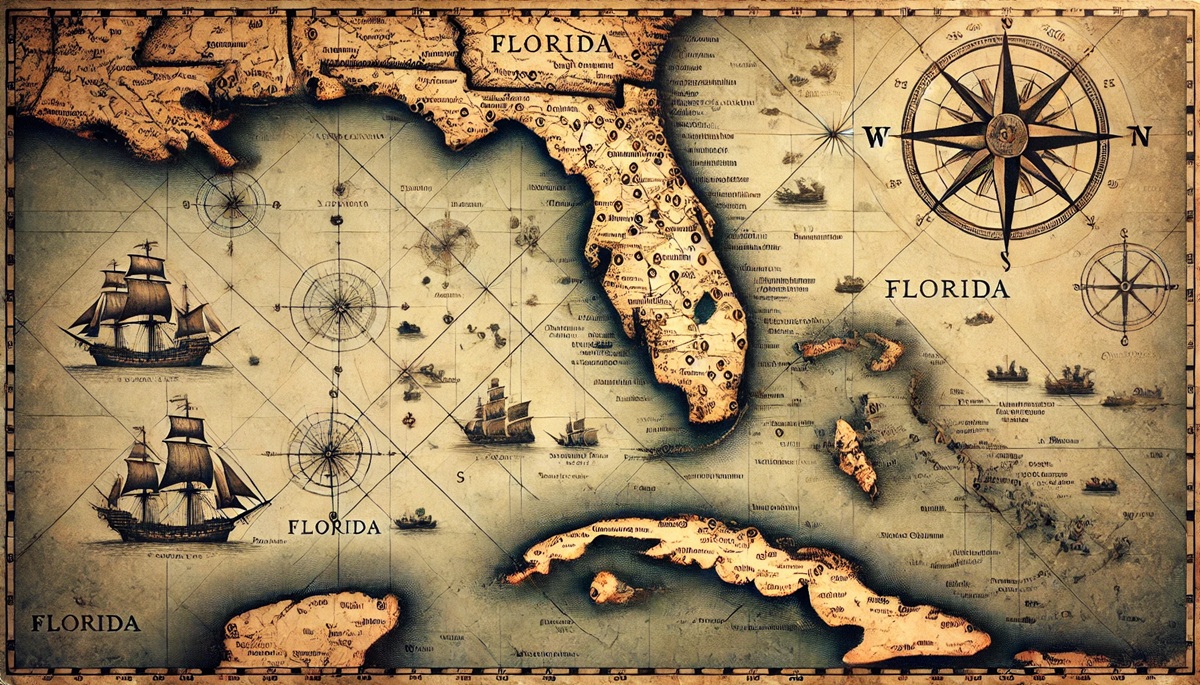
#3: The 1793 Survey of Florida by Andrew Ellicott, 100,000 Square Miles
The 1793 survey of Florida by Andrew Ellicott was a pivotal moment in the history of American cartography and land management. Measuring around 100,000 square miles, this map was part of the process of defining the boundaries between the United States and Spain following the Treaty of Paris in 1783. Ellicott, a skilled surveyor and cartographer, was commissioned to create a precise map of Florida’s borders as the U.S. prepared to take control of the territory. The map includes the St. Mary’s River, which became part of the boundary between Georgia and Florida, as well as early depictions of the Florida Keys and the Everglades region. One of the most fascinating aspects of this map is its accuracy, considering the limited technology of the time. It played a crucial role in defining Florida’s boundaries and was used by both the U.S. government and the Spanish to resolve territorial disputes. Anecdotal stories of the map’s creation highlight the challenges Ellicott faced in navigating the swamps and marshes of Florida, often working under difficult conditions.
#4: The 1835 Florida Map by Josiah E. Colson, 75,000 Square Miles
The 1835 Florida Map by Josiah E. Colson measures about 75,000 square miles and is a comprehensive portrayal of Florida during the early years of its statehood. Colson’s map includes detailed information on roads, rivers, and settlements, providing an invaluable resource for settlers moving into the territory. One of the most interesting features of this map is its depiction of the Second Seminole War, which was ongoing at the time. The map marks military posts, fortifications, and Native American territories, offering a unique look at the region’s military history. The map also provides insight into the expansion of settlements and the development of infrastructure, including the construction of roads and canals. Anecdotal stories often focus on how settlers used this map to navigate through the wilds of Florida, where many areas were still untamed and unexplored.
#5: The 1870 Geological Survey Map of Florida, 60,000 Square Miles
The 1870 Geological Survey Map of Florida, measuring approximately 60,000 square miles, is a crucial resource for understanding the state’s geology. Created by the U.S. Geological Survey, the map provides detailed topographical features, such as the elevation of hills and the depth of rivers and lakes. This map was part of a broader effort to document and survey the natural resources of the United States, particularly as Florida’s population was rapidly increasing and industries like phosphate mining and citrus agriculture began to grow. The map highlights Florida’s unique terrain, including the extensive wetlands, coastal plains, and the rolling hills of the central part of the state. An interesting fact about the map is its use of color coding to represent different geological formations, making it one of the earliest attempts to present Florida’s geology in a visually accessible way. The survey’s findings laid the groundwork for future scientific studies of the state’s environment.
#6: The 1920 Florida Road Map, 50,000 Square Miles
The 1920 Florida Road Map, covering around 50,000 square miles, is an early example of how road maps began to shape the development of Florida’s infrastructure. As the automobile became more popular in the early 20th century, the demand for clear, reliable road maps grew. This map marks the main highways and roads across Florida, showing both established routes and newer, less developed paths. The map is a fascinating glimpse into the state’s growth during the early days of the automobile era. One interesting aspect of this map is the inclusion of both paved roads and gravel roads, highlighting the contrast between urbanized and rural areas. An anecdotal story surrounding this map is how it was used by tourists and new settlers as they traveled to Florida, a state still relatively new to mass tourism. The 1920 road map helped make travel easier and contributed to the booming tourist industry in Florida.
#7: The 1960 NASA Map of Florida, 45,000 Square Miles
The 1960 NASA map of Florida, covering about 45,000 square miles, is a detailed representation of the state during the early years of the space race. The map highlights key locations related to the U.S. space program, particularly Cape Canaveral, where NASA was launching rockets at the time. It also includes information about the state’s infrastructure, population centers, and natural resources. The map reflects Florida’s growing importance as a hub for space exploration, with many anecdotal stories from the era centering around the excitement and mystery of the space program. One interesting fact about this map is that it shows the rapid development of the space coast region, which has since become synonymous with America’s space endeavors.
#8: The 1980 Florida Census Map, 40,000 Square Miles
The 1980 Florida Census Map, spanning approximately 40,000 square miles, is an essential resource for understanding the state’s demographic changes during the late 20th century. It shows population density, racial and ethnic makeup, and the distribution of various age groups across the state. The map is invaluable for researchers, urban planners, and government officials, as it helped shape policies and infrastructure projects during the 1980s. One interesting fact about this map is its role in determining the boundaries for Florida’s congressional districts. The census data it includes has influenced political campaigns and resource allocation in the state. Anecdotal stories often focus on how this map helped guide Florida’s rapid urbanization during the 1980s.
#9: The 2000 Florida Hurricane Risk Map, 35,000 Square Miles
The 2000 Florida Hurricane Risk Map, covering about 35,000 square miles, is an important resource for understanding the risk of hurricanes in the state. The map shows the frequency of hurricane strikes and the potential impact on different regions of Florida. It was created in the aftermath of several major hurricanes in the late 20th century, including Hurricane Andrew in 1992. This map helped guide the development of Florida’s emergency response plans and building codes, particularly in coastal regions. One interesting story surrounding the map is how it contributed to the construction of stronger, more resilient buildings along the coast. The map’s focus on risk areas has been crucial in reducing damage from hurricanes and improving preparedness.
#10: The 2020 Florida Environmental Map, 25,000 Square Miles
The 2020 Florida Environmental Map, measuring approximately 25,000 square miles, provides a detailed view of the state’s natural resources, including wetlands, protected areas, and wildlife habitats. This map is part of an ongoing effort to monitor and protect Florida’s unique environment, which is under constant threat from development, pollution, and climate change. The map shows critical ecosystems such as the Everglades and the Florida Keys, as well as endangered species habitats. One interesting aspect of this map is its use by environmental organizations and government agencies to guide conservation efforts and land use policies. Anecdotal stories often focus on how the map has been used in legal battles over land development and conservation efforts.
Maps of Florida have been essential in shaping the state’s history, growth, and development. From early exploration to modern-day urban planning, these maps provide invaluable insights into Florida’s diverse landscapes, cultures, and industries. Each map tells a unique story, reflecting the challenges and triumphs of a state that continues to evolve. Whether mapping the state’s natural resources, infrastructure, or population, these maps remain crucial tools for understanding Florida’s past and shaping its future.
