GIS maps are a gateway to understanding the complexities of our world. They have transformed how we analyze, interpret, and interact with geographic data, giving us the power to make informed decisions that impact everything from urban planning to environmental conservation. Unlike traditional maps, GIS maps don’t just show locations; they provide layers of information, allowing us to see relationships, patterns, and trends that are hidden in plain sight. Whether it’s tracking deforestation, planning disaster response, managing resources, or analyzing population growth, GIS maps serve as invaluable tools for decision-makers in every field. Their importance stretches far beyond just geography—they are central to sustainable development, helping communities prepare for future challenges, mitigate risks, and protect the environment. By incorporating real-time data, GIS maps offer dynamic, up-to-date snapshots of the world, allowing for immediate action when necessary. These maps empower governments, scientists, organizations, and even everyday citizens with the knowledge needed to address global issues like climate change, urban sprawl, and resource depletion. They have become a vital part of our toolkit for building a more resilient, informed, and connected world. Ultimately, GIS maps are not just about locations—they are about understanding the forces that shape our world and how we can use that understanding to create a better future.
Top 10 GIS Maps
Top 10 GIS Maps
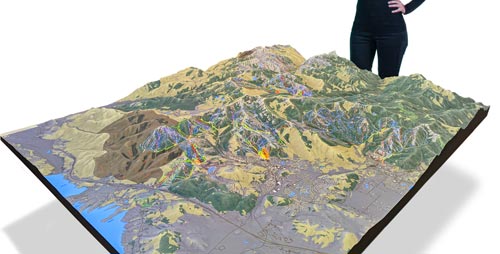
WhiteClouds builds 3D Raised Relief Maps
Geographic Information Systems (GIS) have revolutionized the way we collect, analyze, and interpret spatial data. These maps provide dynamic visual representations of geographic locations, showcasing everything from natural resources to urban planning, environmental changes, and more. Through GIS, the world can be understood on a deeper level, allowing experts and everyday people alike to make informed decisions about how we interact with and manage our environment. Below is a list of the top 10 GIS maps, ranked by their size, importance, and historical impact.
#1: The National Land Cover Database (NLCD), 3,500,000 Acres
The National Land Cover Database (NLCD) is one of the most comprehensive GIS datasets in the United States. Covering a staggering 3,500,000 acres, this database provides detailed land cover information for the entire country, including urban areas, forests, wetlands, water bodies, and more. The NLCD is updated regularly to monitor land use changes, particularly urbanization, deforestation, and agricultural development. This GIS map is used extensively in environmental research, urban planning, and resource management. One interesting fact about the NLCD is its role in disaster management, helping first responders and environmental scientists track land changes after events like wildfires, floods, and hurricanes. Anecdotal stories often highlight how the NLCD has been instrumental in setting conservation priorities, enabling authorities to monitor the health of ecosystems across the nation. The map’s utility extends beyond just scientists, as it is also used by developers, policymakers, and government agencies for land use planning and sustainability efforts.

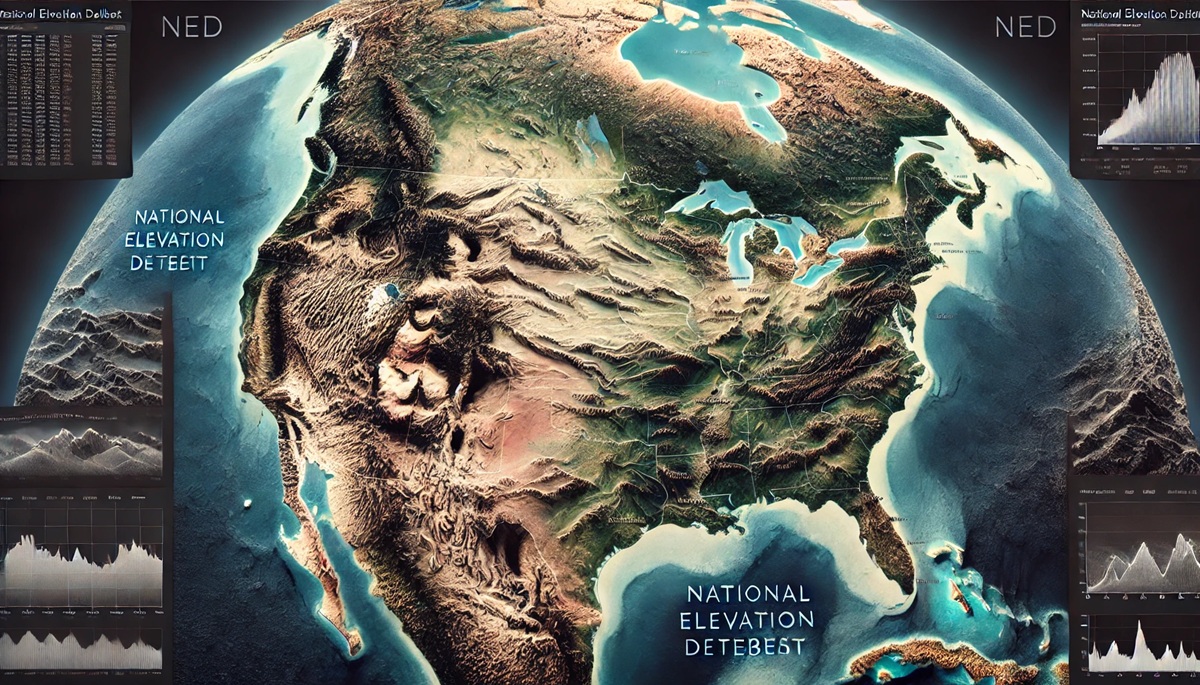
#2: The USGS National Elevation Dataset (NED), 3,000,000 Acres
The United States Geological Survey (USGS) National Elevation Dataset (NED) covers 3,000,000 acres and provides a detailed, high-resolution digital model of the Earth’s surface topography. This dataset includes elevation data for every part of the U.S. and plays a critical role in floodplain mapping, infrastructure development, environmental monitoring, and disaster response. The NED allows users to assess slopes, watershed boundaries, and other vital geographic features, which are especially valuable in natural disaster preparedness. A particularly interesting use of the NED occurred after Hurricane Katrina, where the data helped responders assess the flood risks to different neighborhoods in New Orleans. The NED is an invaluable tool for urban planners, cartographers, and geospatial analysts, offering critical insights into the terrain and helping forecast issues like flooding, landslides, and infrastructure stress. Anecdotal stories from the field often recount how the NED has saved lives by guiding flood evacuation efforts and disaster response strategies.

#3: OpenStreetMap, 2,800,000 Acres
OpenStreetMap (OSM) is one of the largest and most dynamic GIS mapping projects in the world, encompassing an incredible 2,800,000 acres of open-source, user-generated geographic data. Founded in 2004, OSM is a global mapping tool that allows anyone with access to the internet to contribute and edit information. The map covers roads, buildings, waterways, and a variety of other geographical features. It is used in countless applications, from navigation apps like Maps.me to humanitarian efforts such as disaster relief. The collaborative nature of OSM is one of the most fascinating aspects of this GIS map, as its accuracy and comprehensiveness depend on contributions from millions of individuals across the globe. One of the most compelling stories associated with OSM is its use during the 2010 Haiti earthquake, when volunteers mapped out affected areas to assist in rescue operations. The flexibility of OpenStreetMap allows for constant updates, making it a go-to resource for real-time geospatial data.
#4: The Global Digital Elevation Model (GDEM), 2,000,000 Acres
The Global Digital Elevation Model (GDEM) is a product of NASA and the Japan Aerospace Exploration Agency (JAXA), covering 2,000,000 acres and offering an unparalleled global view of Earth’s topography. The GDEM provides 30-meter resolution elevation data for the entire planet, offering a stunningly detailed representation of the Earth’s surface. This dataset has been used for various purposes, including climate change studies, urban planning, flood risk management, and natural disaster research. An interesting feature of the GDEM is its ability to show the world’s highest mountain ranges, including the Himalayas and the Andes, as well as deep oceanic trenches. One anecdotal story about the GDEM is its role in improving flood risk management in coastal areas—by providing detailed elevation data, it helped identify flood-prone regions and better allocate resources during extreme weather events. The GDEM is an essential resource for environmental monitoring and land management, helping decision-makers globally plan for climate change and natural disasters.
#5: The Global Land Cover Map, 1,500,000 Acres
The Global Land Cover Map, which spans 1,500,000 acres, is a GIS resource that categorizes Earth’s surface into various land cover types, such as forests, cropland, grasslands, urban areas, and wetlands. This map was developed by the European Space Agency (ESA) and serves as an invaluable tool for understanding global land use changes. The Global Land Cover Map provides insights into deforestation trends, urban sprawl, and the effects of climate change on different ecosystems. An interesting fact about this map is how it has helped track the loss of biodiversity and monitor environmental degradation across the globe. The map is used by environmental scientists, policy analysts, and conservationists to develop sustainable land management strategies. Anecdotal stories highlight how the Global Land Cover Map has been used in environmental protection efforts, such as preserving wetlands and monitoring agricultural encroachment on natural habitats.
#6: The National Oceanic and Atmospheric Administration (NOAA) Weather Maps, 1,200,000 Acres
The National Oceanic and Atmospheric Administration (NOAA) provides detailed weather maps that cover 1,200,000 acres of the U.S., providing essential data on weather patterns, temperature, humidity, and wind conditions. These maps are invaluable for meteorologists and emergency planners, helping to predict weather phenomena like storms, tornadoes, and hurricanes. NOAA’s weather maps are used extensively in climate studies, resource management, and disaster planning. One interesting aspect of these maps is their integration with real-time satellite data, which gives a highly accurate picture of atmospheric conditions. An anecdotal story about NOAA weather maps involves their use during Hurricane Katrina, where the maps helped predict the storm’s path, aiding in evacuation and relief efforts. The weather maps also play an essential role in public safety, helping inform the public about severe weather conditions and the potential for natural disasters.
#7: The European Space Agency’s (ESA) Sentinel Satellite Data, 1,000,000 Acres
The European Space Agency’s Sentinel Satellite Data covers 1,000,000 acres and provides high-resolution imagery of Earth’s surface, offering key insights into environmental changes, land use, and natural resources. The Sentinel satellites monitor everything from deforestation to urbanization, and their data is essential for studying climate change, crop yields, and even natural disasters like wildfires. The ESA’s Sentinel data is used in a variety of sectors, including agriculture, forestry, and flood risk management. One interesting fact is that Sentinel data was used in the aftermath of the 2015 Nepal earthquake to map the damaged areas and help with relief efforts. Anecdotal stories from environmental scientists often recount how the Sentinel data has played a key role in tracking the effects of climate change, particularly in polar regions where ice sheets are rapidly melting.
#8: The Global Population Density Map, 900,000 Acres
The Global Population Density Map spans 900,000 acres and provides a visual representation of human population distribution across the world. This GIS map highlights areas of high population density, such as major cities like Tokyo, New York, and São Paulo, as well as sparsely populated areas like the Sahara Desert and the Arctic. The Global Population Density Map is an important tool for urban planning, resource allocation, and disaster preparedness. It helps governments and organizations predict the future needs of growing populations, particularly in regions where resources are scarce. An interesting feature of the map is its ability to track migration trends, showing how people are moving from rural areas to urban centers in search of employment and better living conditions. Anecdotal stories highlight the role this map plays in guiding policies for housing, transportation, and infrastructure development.
#9: The Global Disaster Risk Map, 800,000 Acres
The Global Disaster Risk Map covers 800,000 acres and shows areas of the world that are most vulnerable to natural disasters, including earthquakes, tsunamis, floods, and wildfires. This GIS map is an essential tool for disaster preparedness, helping governments, organizations, and communities prepare for and respond to catastrophic events. The map helps identify areas at risk of future disasters based on historical data, environmental factors, and changing climate conditions. An interesting fact about the Global Disaster Risk Map is how it is used by international organizations like the United Nations to allocate resources and aid to disaster-prone regions. One anecdotal story involves the map’s role in helping prepare for the 2011 Tōhoku earthquake and tsunami in Japan, where the map was used to guide evacuation efforts and relief operations.
#10: The Global Forest Watch Map, 750,000 Acres
The Global Forest Watch Map spans 750,000 acres and tracks the world’s forests, monitoring deforestation rates, forest cover changes, and the health of ecosystems. This GIS map uses satellite data to provide near real-time updates on forest loss and gain. It is a crucial tool for environmental conservationists, researchers, and policymakers who are working to protect global forests from illegal logging, climate change, and industrial expansion. One interesting feature of the Global Forest Watch Map is its ability to track forest loss in remote areas, such as the Amazon rainforest. The map is updated frequently, giving users a dynamic view of deforestation trends around the globe. Anecdotal stories from conservationists often highlight how this map has helped bring attention to the need for stronger environmental protections and has driven significant policy changes in countries with high deforestation rates.
GIS maps have transformed the way we study, understand, and interact with the world. From mapping land cover to tracking natural disasters, these tools have had a profound impact on how we manage resources, prepare for crises, and protect the environment. Through advanced technology and detailed data collection, GIS maps continue to shape the future of geography, offering a deeper, more nuanced understanding of our planet. As GIS technology evolves, so too will our ability to monitor and manage the Earth’s resources in an increasingly sustainable manner.


