Yellowstone National Park, the first national park in the world, is a place where nature’s raw beauty and power come together in awe-inspiring ways. From the roaring geysers and hot springs to the deep, lush forests and vast wildlife, Yellowstone is a living witness to the forces that shape our planet. Maps of Yellowstone serve as both guides and storytellers, capturing the ever-changing landscape and helping us understand its complex ecological systems. Whether it’s a topographic map outlining the rugged terrain or a wildlife map showing the migration paths of bison and wolves, each map offers a different perspective on the park’s natural wonders. These maps not only help visitors navigate the park’s vast expanse but also serve as invaluable tools for researchers and conservationists working to protect this ecological treasure. Maps of Yellowstone have played an essential role in its conservation efforts, tracking the effects of climate change, the management of wildfires, and the restoration of native species. They reveal the delicate balance between human interaction and nature’s power, offering insights into how Yellowstone’s geothermal features, waterways, and ecosystems function. For many, Yellowstone is not just a place to visit—it’s a living, breathing landscape that we must understand and protect. And through maps, we can better navigate, appreciate, and safeguard its incredible natural beauty for generations to come.
Top 10 Yellowstone Maps
Top 10 Yellowstone Maps
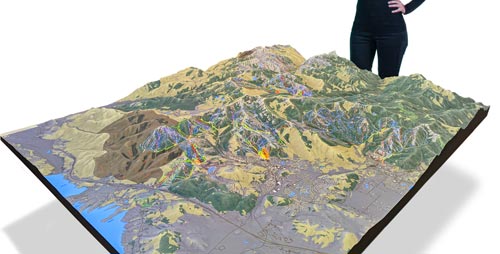
WhiteClouds builds 3D Raised Relief Maps
Yellowstone National Park, established in 1872 as the first national park in the United States, has long been a symbol of natural beauty and ecological diversity. Its vast landscapes, teeming with geothermal features, wildlife, and forests, have drawn millions of visitors from around the world. Over time, numerous maps have been created to help visitors and researchers navigate the park, understand its geography, and explore its unique features. From topographic maps to trail guides, each map tells a story of the park’s history, its environmental significance, and its conservation efforts. Below is a list of the top 10 Yellowstone maps, ranked by their size, historical significance, and unique features that have made them integral to the study and enjoyment of the park.
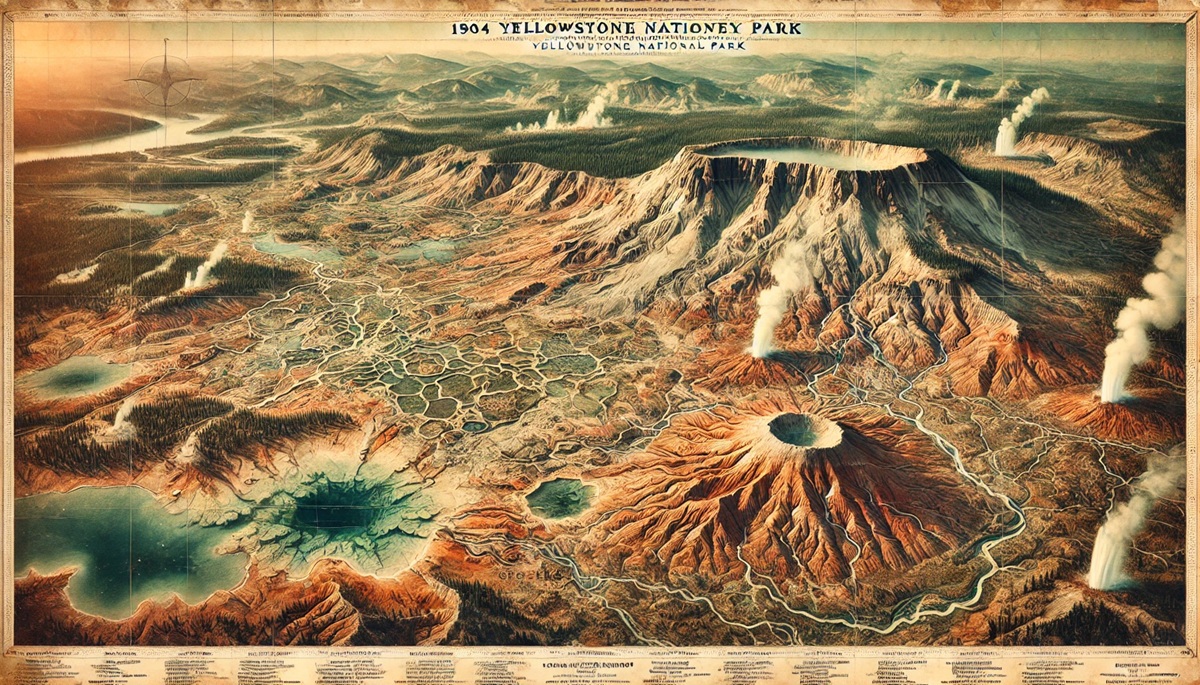
#1: The 1904 Geological Survey Map, 3,500,000 Acres
The 1904 Geological Survey Map of Yellowstone represents one of the earliest and most detailed maps of the park, encompassing approximately 3,500,000 acres of land. This map was created to provide a geological overview of the park, highlighting the geothermal features, including geysers, hot springs, and fumaroles, which make Yellowstone famous. The map not only covers the park’s vast area but also showcases early geological survey data, which was crucial for understanding the park’s natural processes. Interestingly, this map was created just a few decades after the establishment of the park, during a period when much of the landscape was still largely unexplored by scientific communities. One of the most compelling stories surrounding this map is how it helped to solidify Yellowstone’s place in the geological and conservation world. Researchers used it to make groundbreaking discoveries about volcanic activity in the area, which later contributed to studies on plate tectonics. The 1904 map is a confirmation to the early efforts to study and protect Yellowstone’s unique features.
#2: The 1929 Topographic Map, 3,400,000 Acres
The 1929 Topographic Map of Yellowstone covers approximately 3,400,000 acres and was developed by the U.S. Geological Survey to provide a more accurate representation of the park’s terrain. This map is notable for its detailed topographic lines, showing the elevation changes, mountain ranges, valleys, and rivers that define Yellowstone’s landscape. The map also included important landmarks like the Yellowstone River, Lake Yellowstone, and the Grand Canyon of the Yellowstone. The 1929 map was instrumental in guiding early park visitors and park rangers as they navigated the challenging terrain of Yellowstone. It’s fascinating to think about how much of the park was still relatively inaccessible at the time, with many of the most popular hiking trails and roads yet to be established. The map’s level of detail allowed for a better understanding of the park’s vastness and the difficulty of traveling through its remote areas. An interesting anecdote involves how this map was used during the construction of the first paved roads in Yellowstone, which began in the late 1920s. It provided crucial insights into the natural features that would need to be preserved while allowing for public access.

#3: The 1979 Trail Map, 3,000,000 Acres
The 1979 Trail Map of Yellowstone, covering approximately 3,000,000 acres, is one of the most beloved maps for hikers and outdoor enthusiasts. This map focuses on the extensive trail system within the park, highlighting the major hiking routes, campsites, and access points. It also includes details on the park’s many scenic viewpoints, making it a valuable resource for those wanting to explore Yellowstone on foot. One of the most fascinating features of this map is how it helped facilitate Yellowstone’s transition into an era of mass tourism, when increased visitors began flocking to the park in the late 20th century. The trail map allowed for the responsible management of these visitors, offering clear directions and safety information to prevent overcrowding and protect sensitive environments. Anecdotal stories about this map often recount how it was used by families embarking on their first trips to the park, marking their routes on the map as they set out on adventures. This map is also significant for its emphasis on the preservation of wilderness areas and its role in Yellowstone’s broader conservation efforts.
#4: The 1998 Wildlife Management Map, 2,800,000 Acres
The 1998 Wildlife Management Map of Yellowstone covers about 2,800,000 acres and is dedicated to showcasing the park’s diverse wildlife and the areas where specific species are most likely to be found. From bison herds grazing in the Lamar Valley to the elusive wolves in the Yellowstone Plateau, this map provided vital information for wildlife enthusiasts and researchers. The map also highlights conservation zones, showing where efforts were being made to restore and protect endangered species, particularly after the reintroduction of wolves in the mid-1990s. One of the most interesting facts about this map is its role in helping to monitor wildlife populations and migrations in the park. It provided scientists with valuable insights into animal behavior and contributed to long-term studies on Yellowstone’s ecosystem. Anecdotal stories surrounding this map often highlight the sense of awe visitors felt as they used it to track animal sightings during their trips, making it an essential guide for anyone hoping to catch a glimpse of Yellowstone’s wildlife.
#5: The 2006 Hydrology Map, 2,500,000 Acres
The 2006 Hydrology Map of Yellowstone spans 2,500,000 acres and focuses on the park’s water resources, including rivers, lakes, hot springs, and other geothermal features. This map is particularly important for understanding the water systems that sustain the park’s ecosystems. It includes the Yellowstone River, which flows through the heart of the park, as well as smaller tributaries and water bodies like Lake Yellowstone and hot springs like Mammoth Hot Springs. The map was created during a time when researchers were increasingly concerned about water quality, aquatic ecosystems, and climate change’s impact on the park’s watersheds. An interesting fact about this map is its role in guiding conservation efforts related to water usage and pollution control. It helped prioritize areas in need of protection and restoration. Anecdotal stories often reference how this map was used during river research expeditions, providing researchers with detailed data on water flow, temperature, and habitat conditions.
#6: The 2014 Visitor Services Map, 2,200,000 Acres
The 2014 Visitor Services Map of Yellowstone, spanning 2,200,000 acres, provides an essential guide to park amenities, including visitor centers, campgrounds, lodges, and restaurants. This map is particularly useful for tourists navigating the park’s infrastructure, with clear indications of where to find rest stops, gas stations, and emergency services. One of the most interesting features of this map is its accessibility and user-friendliness, designed to be easy to read and navigate for visitors with varying levels of map-reading skills. The map also highlights areas with the best access to popular landmarks like Old Faithful, the Yellowstone Grand Canyon, and the Lower Falls. Anecdotal stories from visitors often describe how they relied on this map to plan their routes and ensure they didn’t miss the park’s signature sights. Over time, the 2014 Visitor Services Map has become an essential item for any traveler, offering guidance for everything from planning a full-day hiking trip to simply locating the nearest bathroom.
#7: The 2019 Geothermal Map, 2,000,000 Acres
The 2019 Geothermal Map of Yellowstone covers around 2,000,000 acres and is dedicated to the park’s geothermal features, including geysers, hot springs, fumaroles, and mud pots. Yellowstone is home to more than half of the world’s geothermal features, and this map highlights them in intricate detail. The map shows the locations of major geyser basins, including the famous Norris, Upper, and Lower Geyser Basins, as well as the locations of geothermal hot spots like Old Faithful and the Grand Prismatic Spring. What’s particularly fascinating about this map is its scientific importance—it was developed as part of ongoing efforts to monitor geothermal activity and predict potential volcanic events. One interesting fact is that it has been used by researchers and park rangers to help guide visitors to safer areas away from active geothermal features. Anecdotal stories about this map often focus on the awe that visitors experience when they first see these otherworldly, colorful hot springs and geysers.
#8: The 2017 Vegetation Map, 1,800,000 Acres
The 2017 Vegetation Map of Yellowstone spans approximately 1,800,000 acres and focuses on the park’s diverse plant life. It highlights the different ecosystems that make up Yellowstone, including forests, grasslands, wetlands, and alpine meadows. The map is essential for understanding the complex relationships between plants, animals, and the environment. The 2017 map also identifies key areas for conservation and restoration efforts, helping park managers prioritize areas that are at risk due to invasive species or climate change. An interesting feature of this map is its detailed depiction of plant communities, from lodgepole pine forests to sagebrush steppe. Anecdotal stories from visitors and rangers often reference the map’s importance in understanding how the park’s plant life supports its incredible biodiversity.
#9: The 1992 Fire Management Map, 1,500,000 Acres
The 1992 Fire Management Map, covering 1,500,000 acres, was developed as part of Yellowstone’s long-term strategy to manage wildfires. The map shows areas prone to fire, including forests, grasslands, and areas affected by previous fires. Wildfires are a natural part of Yellowstone’s ecosystem, but managing them requires precise knowledge of the landscape. The map played a significant role in efforts to control and contain wildfires, especially during the massive fires of 1988, one of the largest wildfire events in the park’s history. The map became a vital tool for fire management teams, helping them identify high-risk areas and plan controlled burns to prevent larger fires from spreading. Anecdotal stories from fire management professionals often highlight the role this map played in saving lives and protecting the park’s delicate ecosystem during critical times.
#10: The 2020 Climate Change Map, 1,200,000 Acres
The 2020 Climate Change Map of Yellowstone, covering around 1,200,000 acres, was created to monitor and predict the effects of climate change on the park’s ecosystems. The map tracks shifts in temperature, precipitation, and snowpack levels, providing a visual representation of how climate change is altering Yellowstone’s landscape. One interesting fact about this map is that it has been used to inform conservation efforts, guiding researchers in the protection of sensitive species and ecosystems. The map has become a tool for understanding how global climate patterns are impacting local environments. Anecdotal stories from conservationists and researchers often discuss how the 2020 Climate Change Map has shaped strategies for future sustainability in Yellowstone.
Yellowstone National Park continues to be a remarkable natural treasure, and these maps have played a pivotal role in ensuring its preservation for future generations. From historical surveys to modern climate predictions, these maps reflect our growing understanding of the park’s complexities and the ongoing efforts to protect its unique environments. Whether guiding visitors, aiding research, or shaping conservation strategies, each of these maps tells a story of how we’ve come to know and love Yellowstone.
